Gold

Data as of 1 Sep 2026 · Source: CME Group

Monthly Updated Monitor

Gold Stress Monitor


Five key indicators of physical-market tightness, refreshed at the start of every month.

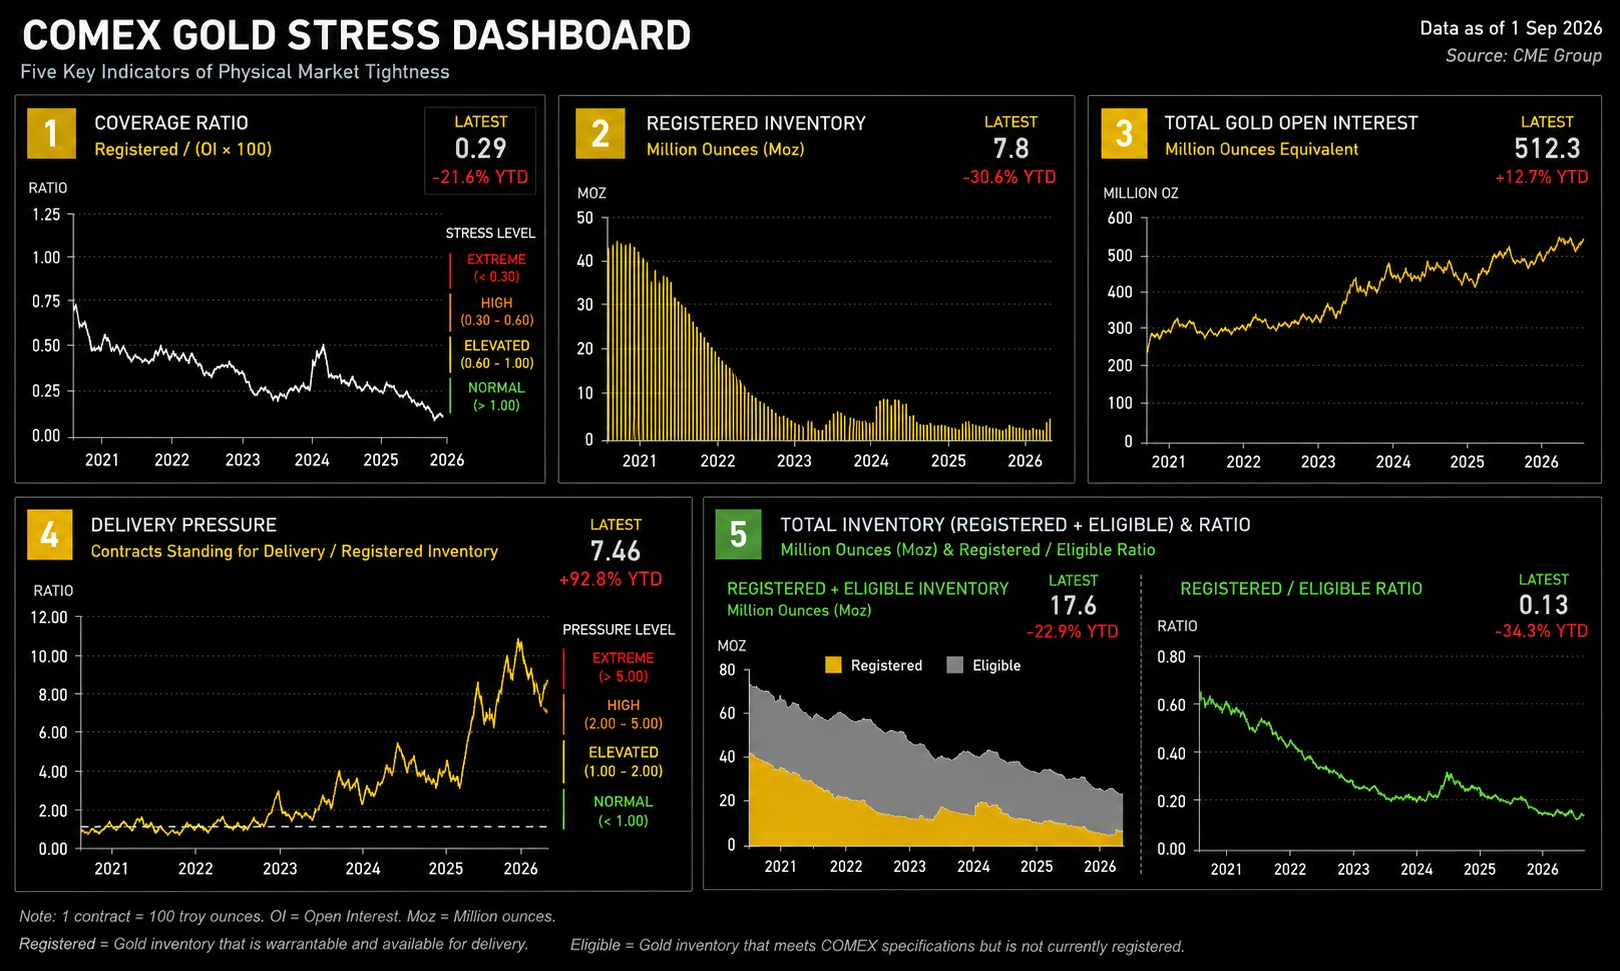
Gold stress dashboard — five key indicators

COMEX Gold Stress Dashboard – August 2026 · Source: CME Group

Updated monthly. Older editions are not archived.

Snapshot Dashboard

Monthly Snapshot


A point-in-time snapshot of the current month. Use the selector to review previous months.

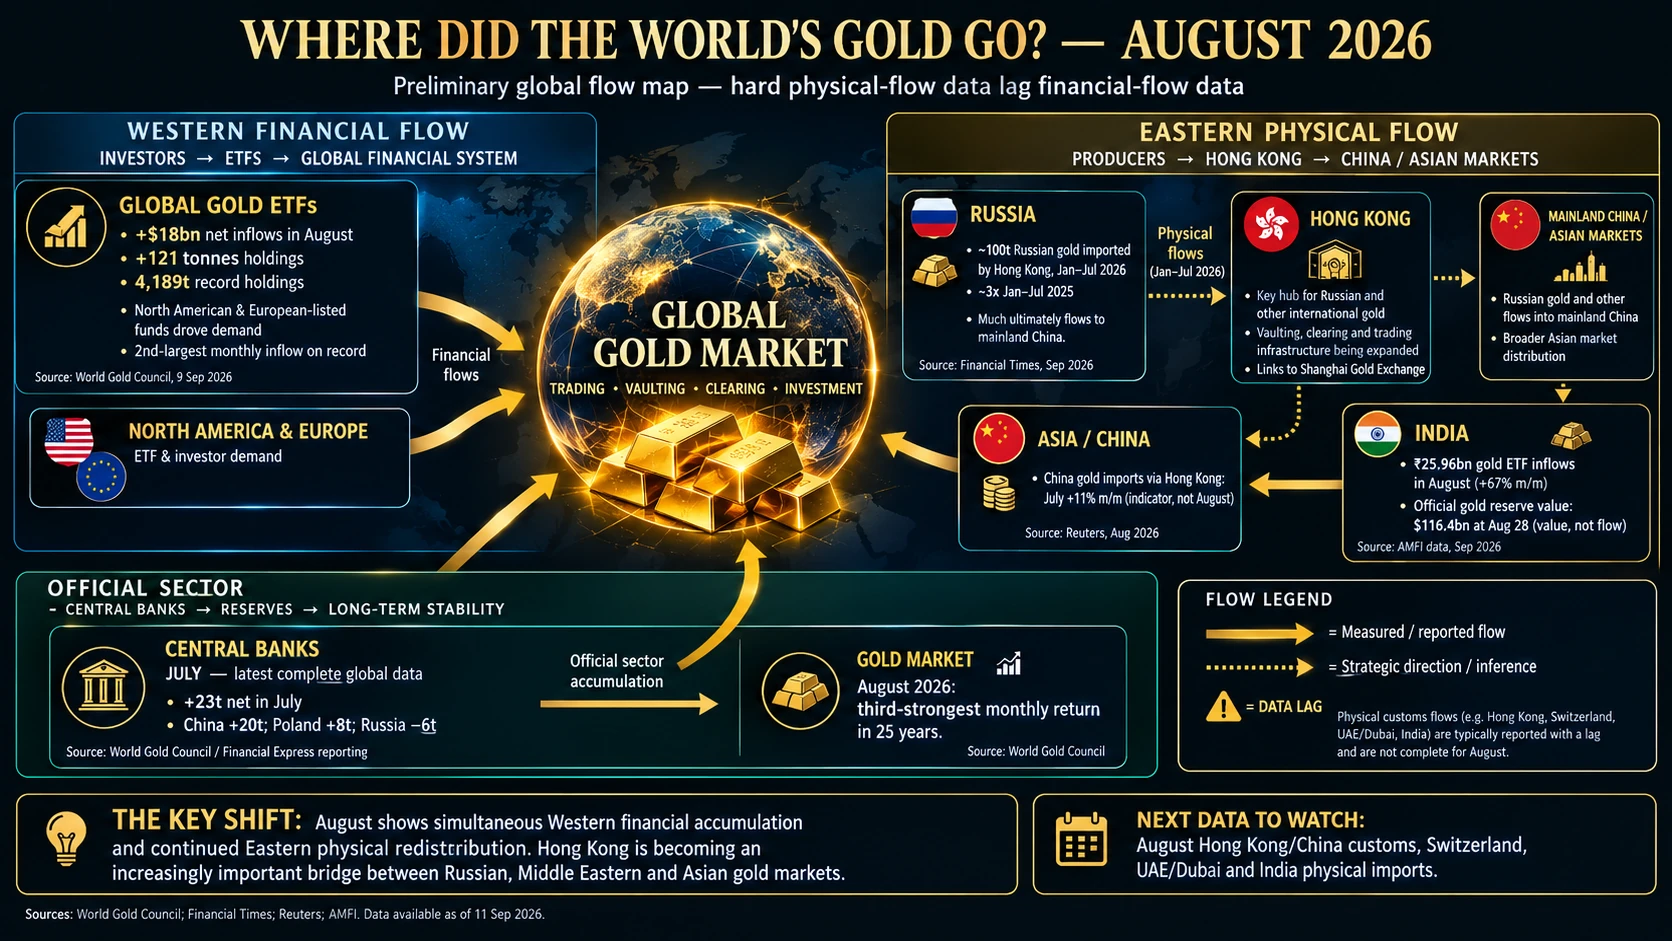
Gold snapshot dashboard

COMEX Gold Snapshot – August 2026 · Source: CME Group

Static Reference

How to Read the Dashboard


Evergreen reference charts – not tied to a specific date.

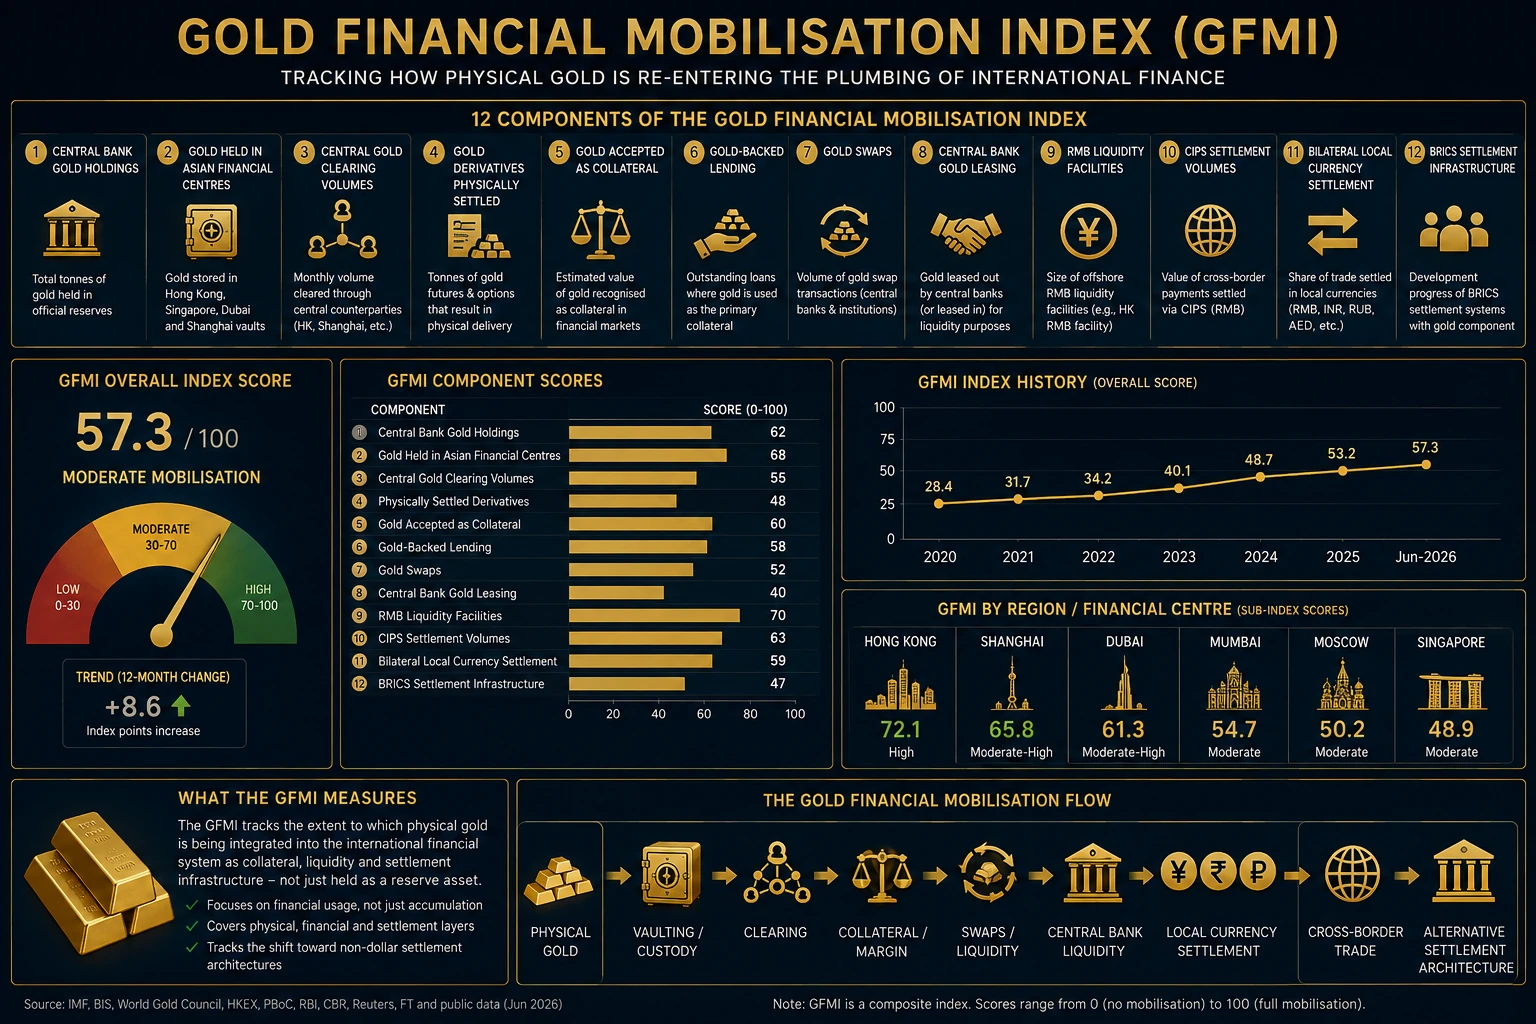
Gold reference infographic

Reference: indicator definitions and stress thresholds.

Text Insight

What the Numbers Are Telling Us


Gold's paper market dwarfs the physical metal held in approved vaults. When open interest (OI) expands while the pool of registered stock stays flat, the coverage ratio falls — a signal that fewer ounces stand behind each outstanding contract.

A large buffer of eligible inventory can be converted to registered if delivery demand rises, which is why gold rarely reaches the acute delivery pressure seen in silver. Still, sustained conversions from eligible to registered are worth watching, as they show the market pulling metal toward the delivery window.

Read the monthly monitor alongside the snapshot archive: the monitor shows the multi-year trend, while month-over-month snapshots reveal how quickly conditions are shifting on a Moz basis.