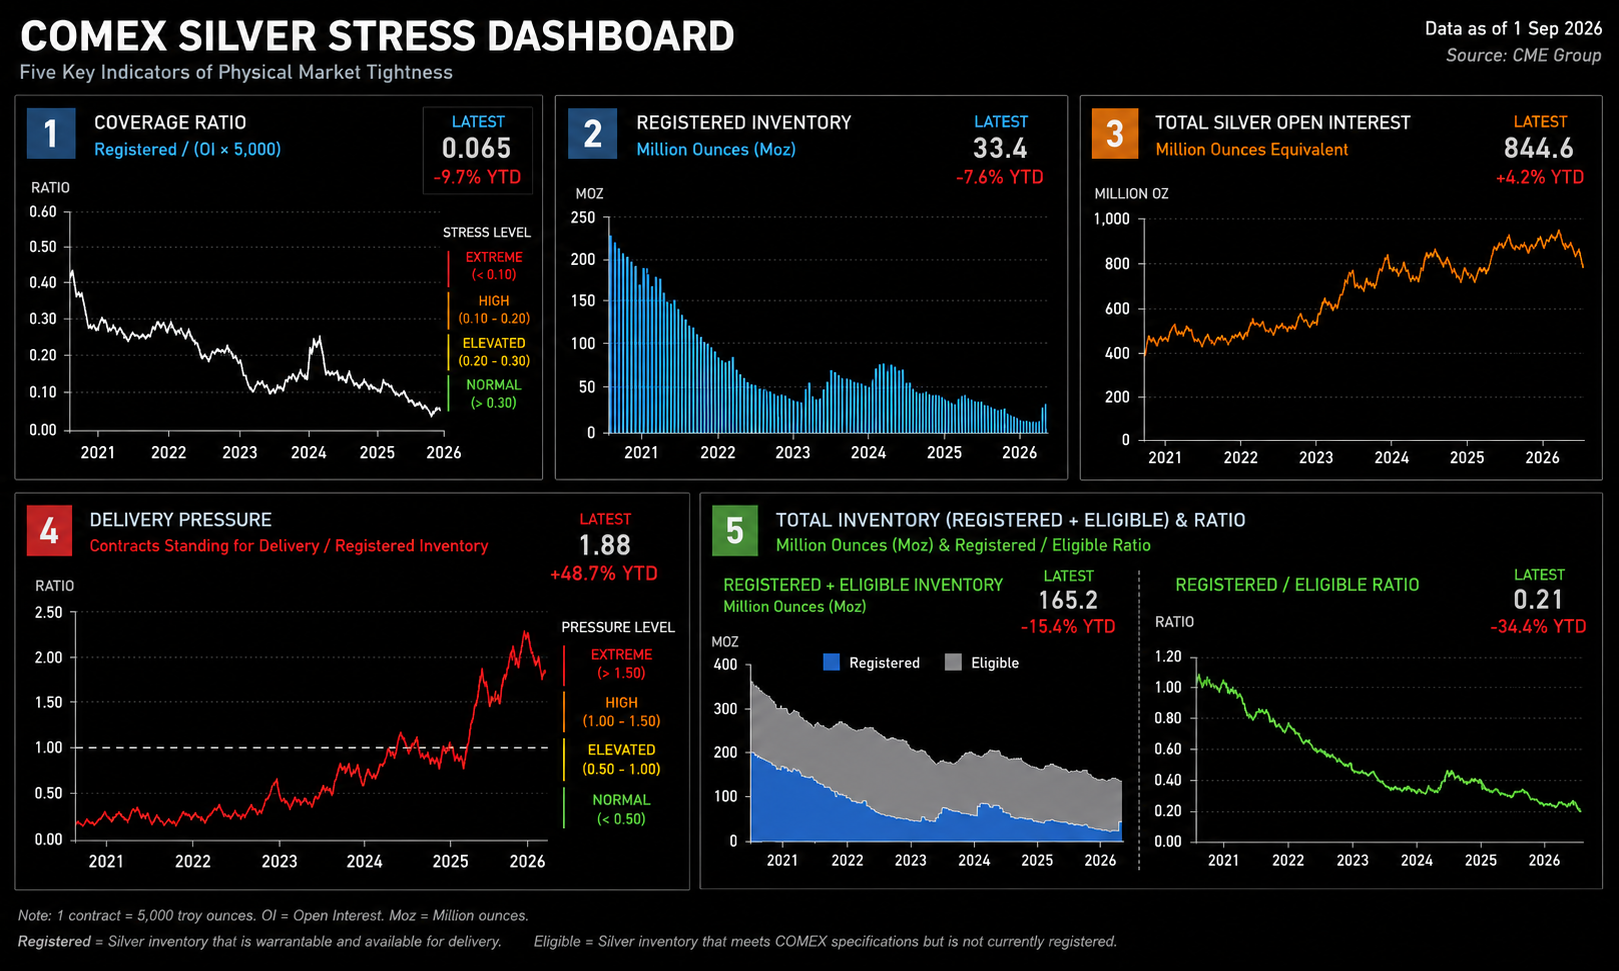
Silver is the tightest of the three markets we track. A falling
coverage ratio — now near extreme
levels — means very little registered
metal backs each outstanding contract, calculated as registered inventory divided by
open interest (OI) in ounces.
At the same time, delivery pressure
has climbed above 1.5 — the extreme band — showing that contracts standing for
delivery now exceed the readily available registered pool. Whether that pressure eases depends
on how much eligible inventory owners choose to
convert into deliverable stock.
Total inventory measured in Moz has trended lower
for several years. Track the YTD change on the
monthly monitor to gauge the pace, and use the snapshot archive to compare month to month.